Tracking interest rates in Bangladesh is no easy task!
Banking sector developments have dominated newspaper reports for the last few years. Although non-performing loan formation took the spotlight for a long period, lately soaring rates on fixed deposits and tight liquidity conditions also came under attention. Much has been written on why the interest rate cycle has turned so sharply and so I move to a slightly different territory.
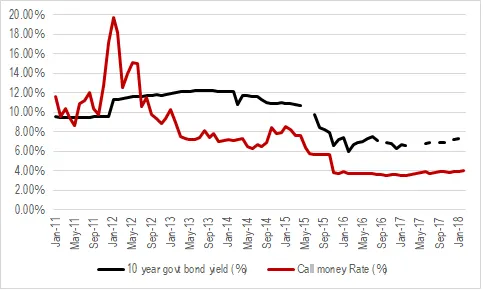
My interest however in on the public data available on interest rates. Generally we can follow a number of the indicators from the central bank website. One is the call money rate, the rate at which one bank lends to another. A quick glance at the rates will show that despite all the hue and cry about liquidity crisis the call money rate has barely bulged. This has happened because there seems to be a verbal guidance from the central bank on what the call money rate should be. This obviously makes the call money market less liquid and prevents it from being an indicator we can use to gauge interest rate conditions.
The second option is to look at yields on government bonds. There also we have a problem as the government has ceased to borrow from the bond market for more than 2 years and instead has been exclusively relying on National Savings Certificates. This lack of demand from the government depresses bond yields and prevents it from showing true liquidity scenario. The 10 year government bond yield is of particular interest to equity analysts because the Capital Asset Pricing Model uses it to form Cost of Equity in valuation models. The 10 year government bond yield in the January auction was 7.39% which means it has barely moved from the lows reached. Using this rate in valuation models will inevitably lead to asset overvaluation.
In the chart below we can clearly see that the government bond yield line is not smooth. Auctions did not take place in those periods.
A third option to track interest rate is looking at weighted average deposit rates. This data comes with a bit of lag and because the rate is an average not just fixed deposits but also current and saving deposits it will not capture the size of the move in interest rates.
Regardless of these data challenges it is very clear that interest rates in reality has gone up. Banks which not too long ago offered as low as 5/6% on fixed deposit have raised that to 9/10%. A 400bps move in a matter of months is a very steep move. And the failure to notice this will lead to missed opportunities and losses. For equity analysts not revising up their cost of equity assumptions will mistakenly feel that equities maybe undervalued. Depositors might also be unaware that rates have been increasing and can lock in lower fixed deposit rates for long periods.
Interest rate and stock prices. What does the theory say?
In a discounted cash flow (DCF) framework keeping all other things constant a higher interest rate in the economy will lead to lower values. The transmission mechanism is generally via the risk free rate (aka 10 year government bond yield) which goes up with interest rates and we end up with a higher cost of equity. Discounting future cash flows with higher discount rates will lead to lower values than the past.
There is a common misconception about companies which have a lot of net cash balance in their balance sheet. We can take the example of Square Pharmaceuticals where cash and marketable securities make up 38% of assets (there is barely any debt either). From an accounting perspective, higher interest rates would result in higher interest income on their cash balances and higher earnings. However if we use the DCF framework then the impact of higher interest rates is a net negative.
Value = Net Cash + PV of future cash flows
Where
Net Cash = Cash – Debt
The net cash on balance sheet is today’s value and is not sensitive to interest rates. The Present value of future cash flows on the other hand reduces leading to a lower value. What is however true is that companies with 0 net cash balances are more sensitive to interest rate hikes and will suffer more relatively. So a company like Square with lots of cash in hand will be less sensitive than companies burdened with a lot of debt like ACI.
What needs to be remembered is that the DCF method only mentions what the ‘intrinsic value’ of a company is. It does not say that price at any given time equals intrinsic value. Understanding the distinction can help us interpret the findings from the next segment.
What if we don’t keep all other things constant?
So far in our discussion we only changed interest rates but made no reference to cash flows. Small changes in interest rates may have no effect on the real economy. But large changes can lead to reduction in consumption as aggregate demand comes down. So some businesses might feel a double whammy as future cash flows could decline and the discount rate used on those flows could go up.
We also need to be clear about what is causing interest rates to move up. An increase in long-term government bond yield could happen because of expectations of faster economic growth (this increases the real risk free rate). In this case however, we are actually revising up our estimates of future cash flow but using a higher discount rate. The net result could be either positive or negative.
Does real world data confirm the theory?
Reality is always a bit more complex and messier than theory suggests. By and large periods of higher interest rates result in lower stock prices (and the theory is proved). However, there are periods in history when higher interest rates coincides with increasing stock prices. In the chart below in the period between 2000 and 2008 higher stock market and higher interest rates happened at the same time for the US market.
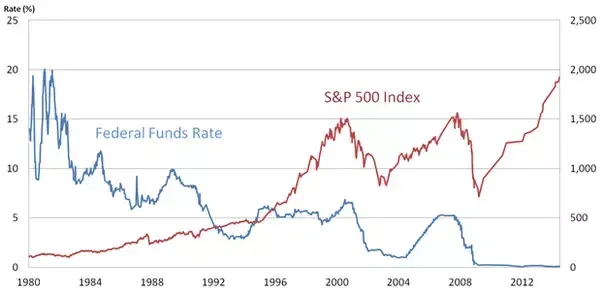
We can try to interpret this data with the benefit of hindsight. The period before 2000 coincided with the Dot Com bubble which led to an overvalued stock market. Even though interest rates came down the stock prices were probably still overvalued. There could have been an overreaction even which is why in the next period stocks actually rallied even though interest rates were increasing.
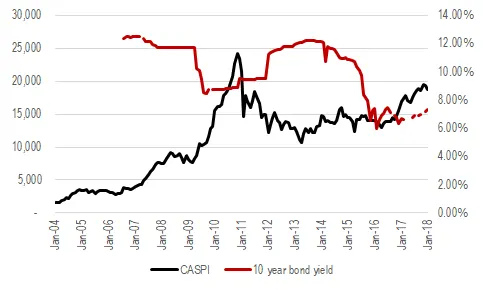
I have similarly tried to replicate using data from Bangladesh market. My choice of index was the Chittagong All Share Price Index (CASPI) which has longer history than the DGEN. With the limited history available it can be concluded that the relationship between interest rates and stocks held for most of the period. The drop in bond yields from 2007-09 coincided with one of the strongest periods for the market. While interest rates started going up from early 2010 the impact on the index only came towards the latter end (with a lag) but held on till mid 2013. Since then yields started coming down and stock market regained much of what was lost.
This proves an important point. The relationship between interest rates and stock prices hold when prices are in equilibrium (price = intrinsic value) or higher than intrinsic value during a period of rising interest rates. If stocks were undervalued to begin with then higher rates may not lead to further stock price declines. In investing world we refer to this as “how much of the risk is already priced in today”.
Final thoughts
Let us have a quick recap of what we have discussed so far.
1. Despite no clear sign from the popular data on interest rate, interest rates in the financial sector have moved up a lot.
2. According to finance theory, higher interest rates should lead to reduction in equity values. Stocks with net cash will also be negatively affected but may perform better than those with lot of debt.
3. Cause of higher rates are also important. Higher economic growth can lead to higher long-term bond yields. This may have a net positive effect as we revise our cash flow projections upwards.
4. In practice there are periods of anomalies where higher interest rates coincided with higher stock prices.
The real effect of interest rates on stocks therefore depends on prevailing stock valuations. If rate hikes are happening when stock valuations (computed using P/E or P/B) are already very high then we will inevitably see stock prices decline. If they aren’t then its harder to predict how prices will end up reacting.
Source: Data for the first chart is from Bangladesh Bank. The bond yields only show yields on new auctions. The data from the second chart sourced from a Quora question on the same topic.